Classic Value Stream Analysis
Value stream analysis is one of the most important methodological skills for improving manufacturing processes. Working with those involved in the process, an expert analyzes the material flow of a value stream step by step, recording, among other things, the duration of work steps, setup times, dwell times, and transport times. The dependencies between process steps are documented, as well as influencing control variables such as lot sizes. At the same time, the information flows necessary for managing production as a value-added process are also documented. These include manual, often paper-based information transfers and the distribution of information via IT systems. The latter, in particular, has become increasingly complex over many years due to the digitization of manufacturing. Thus, not only are person-to-person information flows via IT solutions important, but machines also communicate with one another through IoT.
This analysis is typically conducted through workshops, interviews, and on-site inspections of the production line. This results in a documented process using a standardized modeling methodology. During the initial assessment—particularly when conducted by external experts—problems are often identified and documented during discussions. Areas for improvement are often flagged during the analysis using standardized symbols (e.g., a lightning bolt symbol). Within one to three days, intensive collaboration results in a complete, standardized process model that includes detailed information and opportunities for improvement.
Value Stream Design as a Means of Realizing Potential
The collected data is then evaluated by experts and compared with standard production systems. In particular, the opportunities already identified through the analysis are examined in greater depth and evaluated. This analysis results in a list of opportunities with varying weights, which are incorporated by the factory or production line planner and translated into a new value stream design. This results in a new factory layout, optimized process lines, improved manufacturing and assembly steps, new areas of responsibility, modified workflows, more transparent information flows, appropriate software functionality, and so on. The overall plan can be broken down into action plans or project plans.
Strengths of Traditional Value Stream Analysis
The classic value stream analysis method offers many strengths that can be leveraged, regardless of whether a pull-based, self-regulating, or push-oriented, planning-intensive production system is in place. These strengths can be summarized as follows:
-
- Comprehensive Overview: Tracks the entire flow of materials and information along the value chain.
-
- Identifying Waste: Highlights bottlenecks, downtime, unnecessary transportation, and duplicate work.
-
- Creating transparency: Visualize processes, dependencies, and responsibilities—in a way that’s easy for everyone involved to understand.
-
- Quickly identifying opportunities for improvement: Concrete indications of potential for optimization emerge as early as the analysis phase.
-
- Promotes cross-functional collaboration: Brings employees from production, planning, logistics, and IT together around one table.
-
- Basis for strategic decisions: Provides the foundation for well-informed investments, automation, or digitalization initiatives.
-
- Standardized Methodology: Comparability and Reusability Through Standardized Symbols and Process Models.
-
- An Easy Introduction to Lean Management: Particularly well-suited as a starting point for continuous improvement processes (CIP).
-
- Digitally expandable: When combined with IoT, MES, or AI, real-time data can be integrated and processes can be monitored dynamically.
Software products for traditional value stream analysis
There are numerous software solutions on the market that can be divided into three categories:
| Category | Tool | Brief Description | Focus / Special Features |
| Specialized VSM Tools | iGrafx Value Stream Mapping | An intuitive tool for modeling value streams with a Lean focus | Integration of process optimization |
| Lucidchart / Miro / Visio (with VSM templates) | Visual platforms with templates for value stream mapping | Ideal for initial digital approaches | |
| LeanIX Value Stream Management | Applies value stream thinking to IT and software development | Particularly well-suited for digital transformation projects | |
| Production-Oriented MES/Analysis Tools | Combination of traditional VSM with digital data collection from production | Close integration with production, easy implementation | |
|
| Toolify VSM | Web-based tool for digital VSM, including time tracking and automated analysis | Time data integration, easy to use |
| VISTALOGIC Value Stream Designer | Modeling Actual/Target Processes with ERP/MES Data Integration | Deep Integration with Existing Systems | |
| Data-Driven & AI-Powered Solutions | Celonis (Process Mining) | Analysis of real-world processes based on ERP data | Not specifically designed for VSM, but powerful for optimization |
| Symestic / Guardus MES | MES Systems with Analysis Functions for Continuous VSMIntegration of Real-Time Data and Process Data | ||
| Kepware + Power BI | Combination of IoT data integration (Kepware) and data visualization (Power BI)Creation of digital twins |
These tools provide a starting point ranging from process modeling to in-depth data analysis in production-related IT systems. They support value stream analysis in a variety of ways, but are not, strictly speaking, standalone tools and therefore cannot map a digitized value stream analysis.
What is a digital value stream analysis?
Traditional value stream analysis already has many strengths and can be helpful in digitalization projects, but the method itself is not digitalized. It always represents only a snapshot at the time of the respective workshop and, due to the complexity of reality, almost always covers only a portion of a value stream—for example, related to a product group or a subprocess.
The ideal scenario is the complete digitization of the value stream (the core concept of Industry 4.0) combined with the analytical approaches of classical value stream analysis. This is only possible if the entire approach is rethought.
Digital value stream analysis operates in real time and captures all necessary process data during ongoing operations. It immediately performs a value stream analysis. The focus is on the movement of materials and time in value-adding processes. To achieve this, two approaches are combined:
-
- Real-Time Production Control
-
- Real-time analysis of the value stream
What is real-time control?
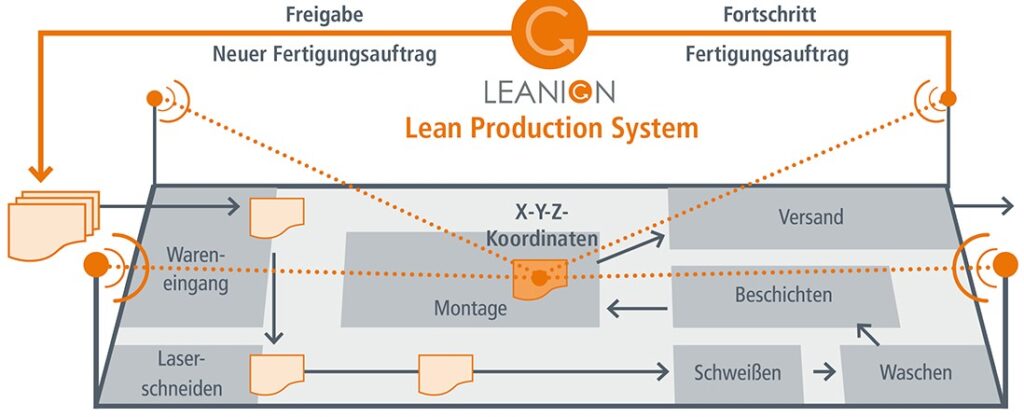
The concept of real-time control is based on a research initiative launched by Landshut University of Applied Sciences in 2012 as part of the LOS1 project, in which all key status information regarding material flows is displayed within the factory layout. The basic idea is not to provide yet another dashboard, traffic light indicator, or status list, but rather to visualize control-relevant information directly at the point of action on a factory map.
This requires technology capable of tracking moving objects in real time—a so-called RTLS (Real-Time Location System). The following technologies are used for this purpose:
| Technology | Location Accuracy | Range | Costs | Benefits | Disadvantages | Typical Applications |
| RFID (passiv) | 1–5 meters | Up to 10 m | Low | Inexpensive, no battery required | Short range, no active tracking | Logistics, Access Control |
| RFID (active) | < 1 m – 10 m | Up to 100 m | Medium | Real-time capable, longer range | Battery replacement required, higher costs | Inventory Management, Security |
| Bluetooth Low Energy (BLE) | 1–3 meters | Up to 50 m (indoors) | Low – Medium | Widely used, energy-efficient | Signal interference, reduced accuracy | Indoor Navigation, Retail Tracking |
| Wi-Fi | 5–15 meters | Up to 100 m (indoors) | Medium | Use of existing infrastructure | Low accuracy, interference | Office buildings, hospitals |
| Ultra-Wideband (UWB) | < 30 cm | Up to 100 m | High | Very precise | Expensive, infrastructure-intensive | Manufacturing, robotics, hospitals |
| Infrared (IR) | < 1 m | Line of sight required | Low – Medium | Highly accurate location data | Line of sight required | Operating rooms, meeting rooms |
| ZigBee | 1–5 meters | Up to 100 m | Medium | Mesh-compatible, energy-efficient | Low data rate, not widely used | Industrial automation |
| GPS (only outdoors) | 2–5 meters | Global | Medium | Available worldwide, high accuracy outdoors | No reception inside buildings | Fleet Management, Construction Sites |
| Computer Vision (Cameras) | < 1 m | Dependent on the room | High | Precise tracking using image data | Privacy concerns, high infrastructure costs | Smart retail, security monitoring |
| Cavea Mesh | 5–7 Meter (typical) | Scales (Mesh Network) | Low – Medium | Scalable, energy-efficient, decentralized architecture, no gateways required | Lower accuracy than UWB; new technology | Warehouse logistics, industry, smart buildings |
Using these technologies, the real-time control system locates individual order items—such as containers and individual materials—as well as logistics assets—such as forklifts and tugger trains—and other mobile bottleneck resources, such as tools and testing equipment.
The objects to be tracked are paired with the corresponding tag, allowing their location and any movement to be recorded in real time. The technology used depends on the required level of accuracy and the frequency of location tracking. In practice, UWB is primarily used due to its accuracy and tracking frequency, while BLE and Cavea Mesh are used in peripheral areas.
Depending on the available target data, delayed orders, deviations from the work plan, or unstable process steps can thus be displayed in real time—along with all necessary information—on the respective factory map. Responsible employees are alerted and can respond immediately upon the occurrence of an incident and actively intervene in production.
This technology is essential for digital value stream analysis. The collected movement and status data are analyzed immediately and presented in the context of value creation.
How does digital value stream analysis work?
In real-time control, so-called geofences are defined on the factory map. These are customizable zones that can cover any area within a production facility. Typical geofences include, for example:
-
- Assembly workstations
-
- Machines
-
- Waiting areas before and after process steps
-
- Storage facilities such as supermarkets, …
-
- Transport areas, such as walkways, conveyor belts, …
-
- Quality assurance
Value-adding geofences are generally derived from the work plans.
A wide variety of attributes—such as process groups, lines, activity types, and the like—can be assigned to these geofences. For value stream analysis, the value-adding attribute is crucial:
-
- Value-Adding Activity
The product becomes “more valuable” through the activity—for example, when assembling products that incorporate labor, materials, and additional functionality.
- Value-Adding Activity
-
- Non-value-adding activity
The activity does not make the product “more valuable,” because no changes are made to the product—such as in a waiting area in front of a machine.
- Non-value-adding activity
-
- Value-Enabling Activity
The activity does not make the product “more valuable,” but it is necessary to enable subsequent process steps, such as the cooling period after a kiln.
- Value-Enabling Activity
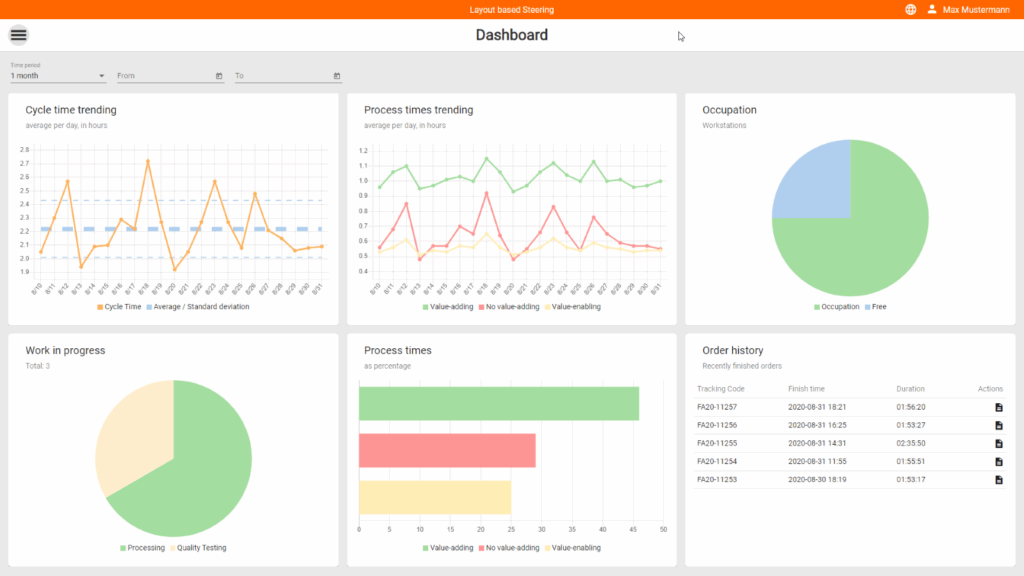
Using real-time control, the digital value stream analysis determines the current value-added status for each individual production order every second and displays it in two ways:
Real-Time Value Creation The current level of value creation in manufacturing can be displayed in real time using status indicators, such as
-
- Number of Activities by Value Added
-
- Time Allocations for Current Activities by Value Added
-
- Trend Analyses of Value Added
-
- Variance Reports by Value Added
Analysis of the Complete Value Stream
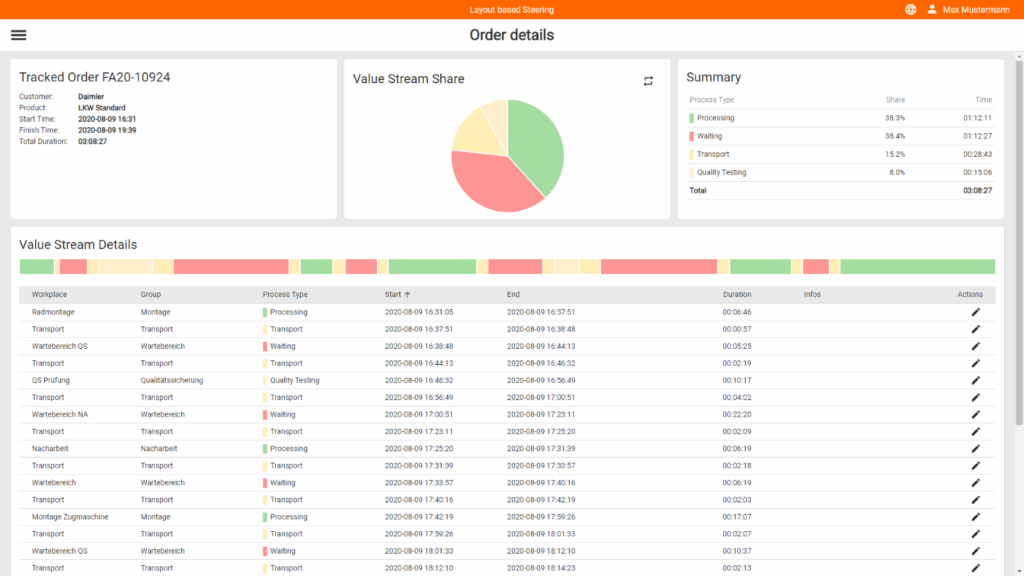
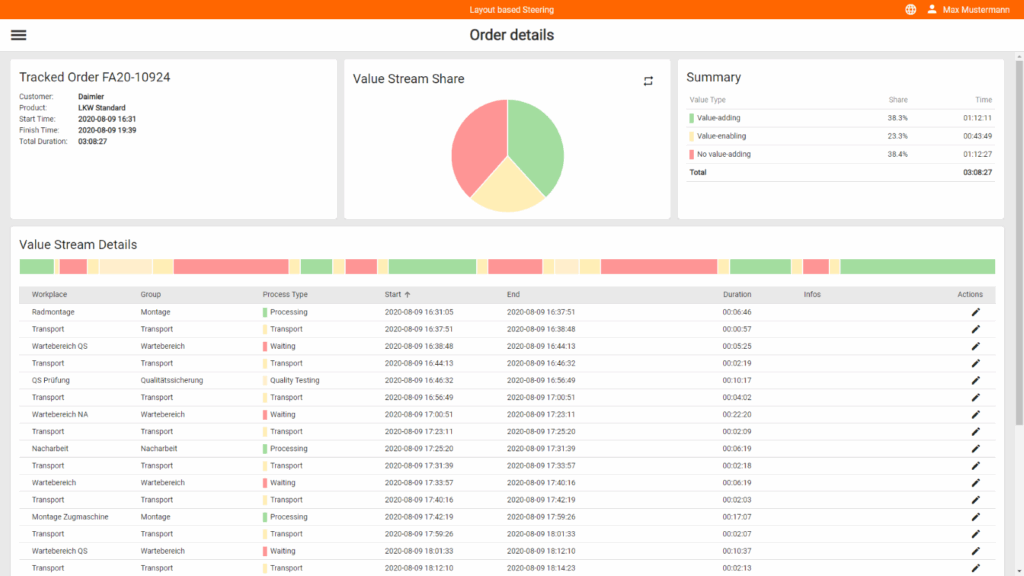
A detailed value stream analysis is available for every production order at every point in time. The complete value stream is digitized at all times. This enables the following analysis options:
-
- Analysis of a Single Value Stream
-
- Analysis of order groupings, e.g., by customer
-
- Analysis of value-added categories, e.g., by value-added activity
-
- Analysis of process groups, e.g., by prefabrication
-
- Benchmark analyses
-
- Trend analyses
Benefits of Digital Value Stream Analysis
Digital value stream analysis is not comparable to the approaches listed above in terms of its methodology and IT implementation. In addition to the benefits of active, real-time production control—which serves as the foundation for digital value stream analysis—each company must evaluate the following five benefits on a case-by-case basis:
-
- Current Value Creation
The employees responsible can view the level of value creation and its trends and take appropriate action.
- Current Value Creation
-
- Complete Transparency
Every order cycle (single value stream) is recorded at every point in time and in every possible status.
- Complete Transparency
-
- Faster Response Times
Real-time data, trends, and deviations enable immediate action at the scene.
- Faster Response Times
-
- Focus on the Essentials
The information from the value stream analysis highlights the most important potential in a commercial operation—namely, the degree of value creation. By focusing on this information, more in-depth root cause analyses can be conducted and opportunities for optimization can be identified.
- Focus on the Essentials
-
- Extent of Digitization
The comprehensive recording of all value streams enables further processing options, such as process documentation using digital twins, complex holistic analyses with AI, or the implementation of value stream-based activity-based costing.
- Extent of Digitization
Conclusion
Digital value stream analysis is a completely new technological approach based on a methodology that has been proven over decades. It does not replace other methods or IT solutions, but rather adds a completely new perspective that was previously unattainable.
Digital value stream analysis focuses on what matters most: “Are we creating value, or are we wasting our valuable resources?”
Author of this expert opinion

Klaus-Oliver Welsow is the managing partner of UWS Business Solutions GmbH, a consulting firm specializing in digital transformation. As early as the early 1990s, he supported the first lean initiatives in the automotive industry from an IT perspective. After completing his degree in business informatics with a focus on production control, he co-founded UWS Business Solutions in 2003 with his business partner André Unger. Since then, the two entrepreneurs and their team have been supporting large-scale digitalization initiatives and lean management projects, and have developed the LEANION lean production system.